Ask most business owners which marketing channel brings in their customers and you get a shrug, a guess, or a story about one memorable client. That is not a criticism. It is the default state, because nothing tells you where a lead came from unless you deliberately set it up.
The cost of that gap is real money. When nobody knows what is working, budget decisions get made on which channel feels busiest, and the quiet channel that quietly pays the bills is the one that gets cut in a slow month.
Everyone Has an Unknown Pile
Open your analytics and you will find a large group labeled direct, unassigned, or nothing at all. Those are real people whose path you cannot reconstruct. They typed your name in after seeing a van, clicked a link a friend texted them, or found your Google listing and called instead of clicking anything. On a typical small business site that group is well over half of all leads.
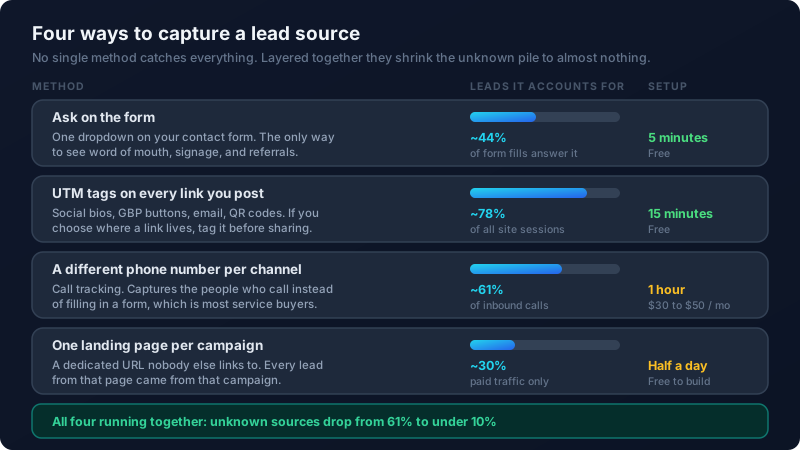
No single tool closes that gap. Four inexpensive habits, layered on top of each other, close most of it.
Tag Every Link You Control
Any link you post yourself can carry three small tags that tell your analytics exactly where the click came from. Your social bio, the button on your Google Business Profile, every email you send, the QR code on a flyer. If you decide where the link lives, tag it before you share it.
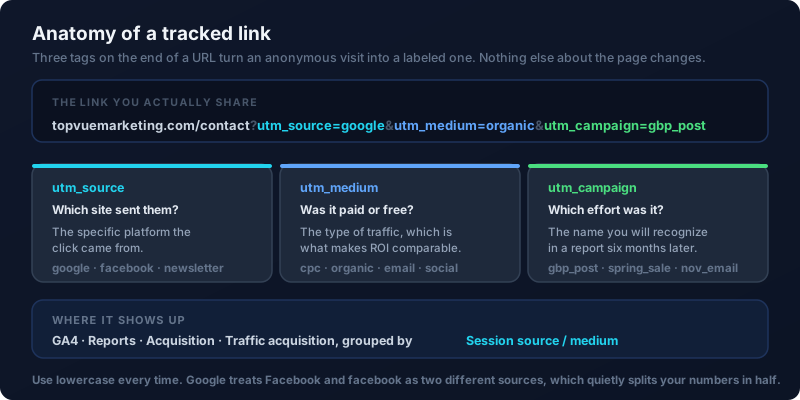
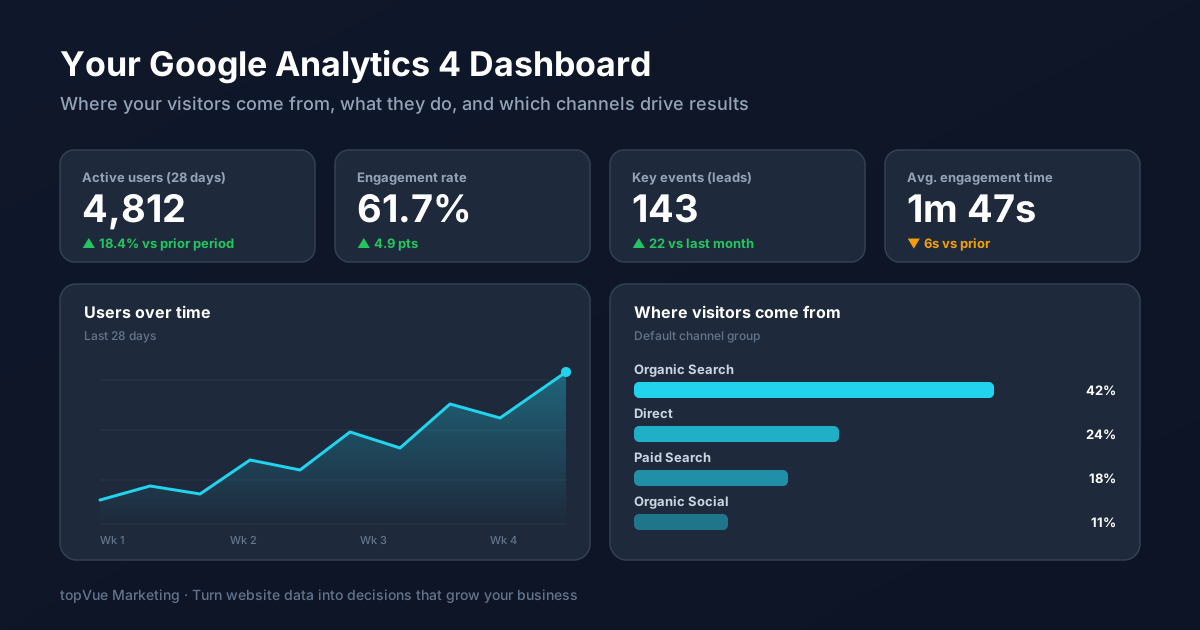
Two rules keep this from turning into a mess. Use lowercase every time, because Google treats Facebook and facebook as separate sources and will quietly split your numbers in half. And keep a running spreadsheet of the campaign names you have used, so the report you read in six months still makes sense. Once tagging is in place, the traffic acquisition report in Google Analytics 4 becomes genuinely readable.
Just Ask, Because Some Sources Are Invisible
Tags cannot see a conversation at a kid's soccer game. Add one optional dropdown to your contact form asking how the person heard about you, with six specific options and an other field. Keep it optional so it never blocks a submission.
Roughly four in ten people answer, and their answers are the only visibility you will ever have into word of mouth, signage, vehicle wraps, and referrals. Those are frequently the sources with the highest close rate, and they are invisible in every analytics tool ever built.
Count the Phone Calls
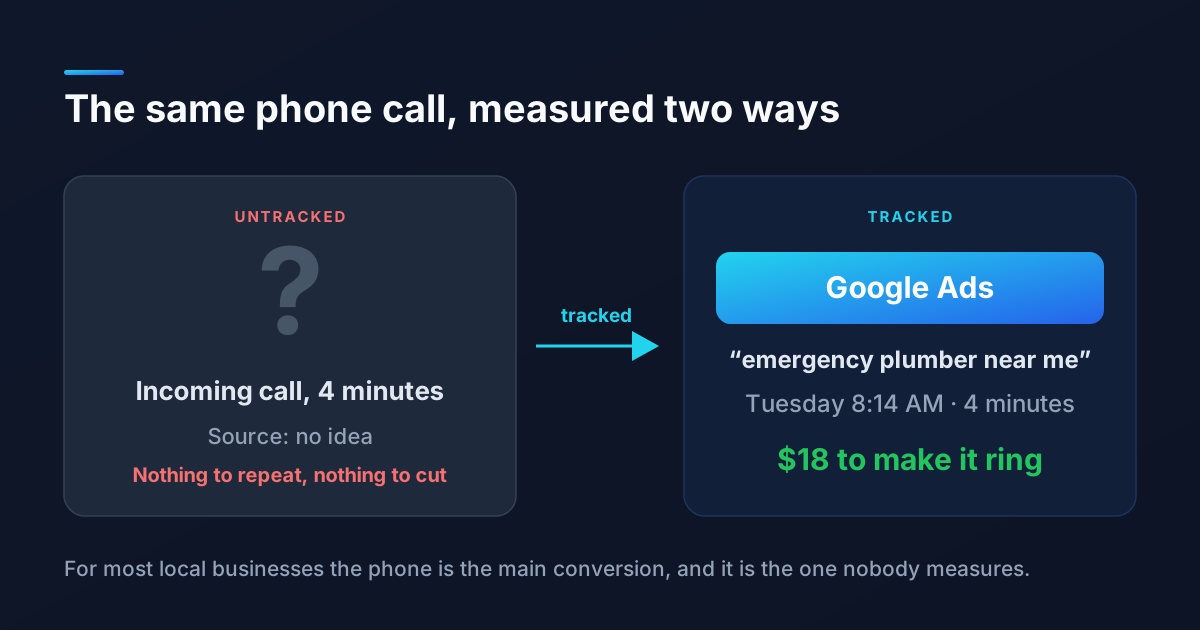
For most service businesses the majority of serious inquiries arrive as phone calls, which means a form based view of your marketing is missing the better half of your leads. Call tracking assigns a different phone number to each channel so you can see which one is ringing. It runs about thirty to fifty dollars a month and is usually the single highest value item on this list.
It pairs well with fixing what happens after the phone rings, since how fast you respond to a new lead tends to matter more than where the lead came from in the first place.
Judge Channels on Revenue, Not Lead Count
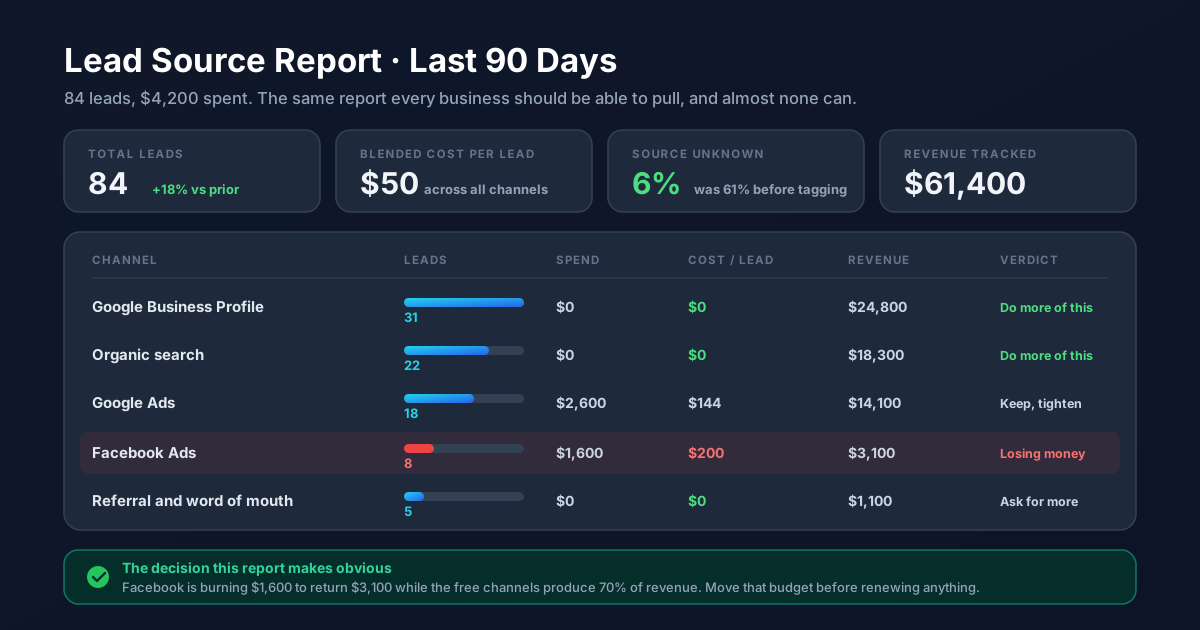
This is where most reporting goes wrong. A channel that delivers cheap leads can still be your worst performer if those leads never buy. Track four numbers per channel: leads, spend, deals closed, and revenue. The channel with the lowest cost per lead and the channel with the lowest cost per customer are often not the same one, and only the second number should drive your budget.
If you are running paid campaigns, this only works when conversion tracking is set up properly. Without it you are optimizing toward clicks, which is a metric that has never paid anyone's rent.
Make It a Thirty Minute Monthly Ritual
Once a month, in the first week, build one simple table with a row per channel and those four columns. It takes about half an hour and it will change at least one decision almost every time. Most owners discover that their Google Business Profile is producing more revenue than anything they pay for, and that one paid channel has been losing money for months.
You do not need perfect attribution. You need enough signal to stop funding the wrong thing. If you want help setting this up so the numbers arrive without the manual work, reach out and we will build the tracking with you.
Frequently Asked Questions
How do I know where my leads are coming from?
Layer four methods rather than relying on one. Add a how did you hear about us question to your contact form, put UTM tags on every link you share yourself, use call tracking numbers if a meaningful share of your inquiries come by phone, and give each paid campaign its own landing page. Any one of these leaves gaps, but together they typically account for more than 90% of leads.
What is a UTM tag and do I need one?
A UTM tag is a short piece of text added to the end of a link that tells your analytics where the click came from. You need them for any link you post yourself, including social bios, email campaigns, your Google Business Profile button, and QR codes. Without them, all of that traffic collapses into vague buckets like direct or referral and you lose the ability to compare channels.
Why does Google Analytics show so much direct traffic?
Direct traffic is the bucket for any visit with no source information attached, which includes people typing your URL, clicking a link in a text message or a PDF, and untagged links from apps. A large direct number usually means links are going out untagged rather than that everyone knows your brand. Tagging the links you control is the fastest way to shrink it.
Is call tracking worth it for a small business?
If phone calls make up a meaningful share of your inquiries, yes. At roughly thirty to fifty dollars a month it typically pays for itself the first time it reveals that a channel you were about to cut is actually producing calls, or that one you are funding produces none. If nearly all your leads arrive through forms, skip it and put the effort into tagging instead.
How often should I review which marketing channels are working?
Monthly is the right rhythm for most small businesses. Weekly reviews tempt you to react to normal fluctuation, and quarterly reviews let a failing channel burn money for too long. Look at a rolling ninety day window when you review, so seasonal swings and a single unusually good week do not distort the picture.